

Roads and platforms
Cut and fill along a new alignment, one zone at a time.
Earthworks and volumes
Answer it from two scans, in a browser. Draw a zone on the point cloud, pick the earlier and the later scan, and Time Compare in SpatialSense shows where material was cut and filled, with the net volume change in cubic metres.
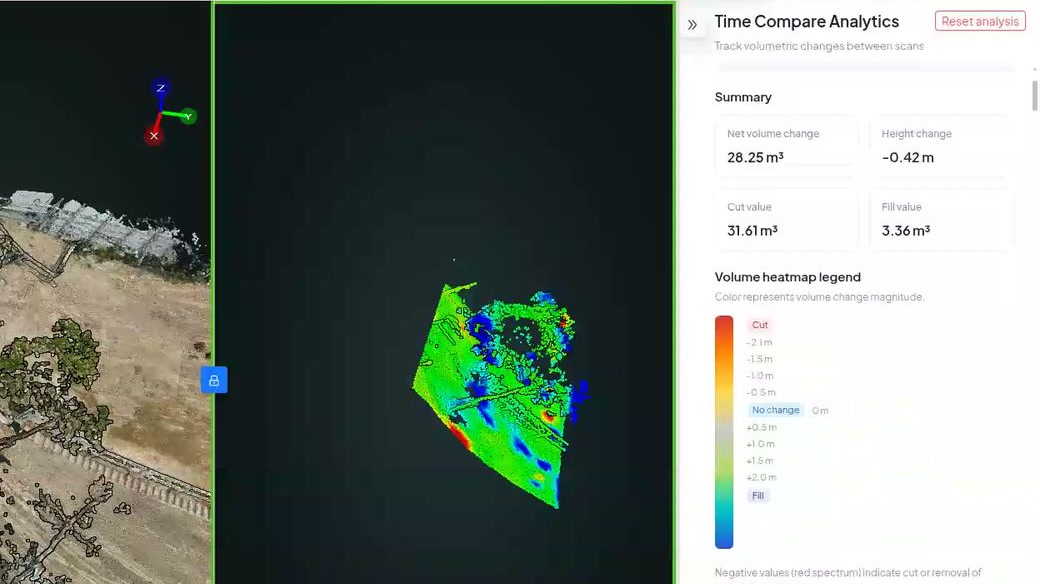
Cut and fill is the difference between two surfaces. If you have a scan of the ground on two dates, that difference is already in your data. Time Compare in SpatialSense works it out for a zone you draw: a colour heatmap of material removed (cut) and added (fill), the net volume change in cubic metres, and the height change in metres. The results are saved with the survey, so you can come back to them next month.
Both scans need to be georeferenced and in the same project.
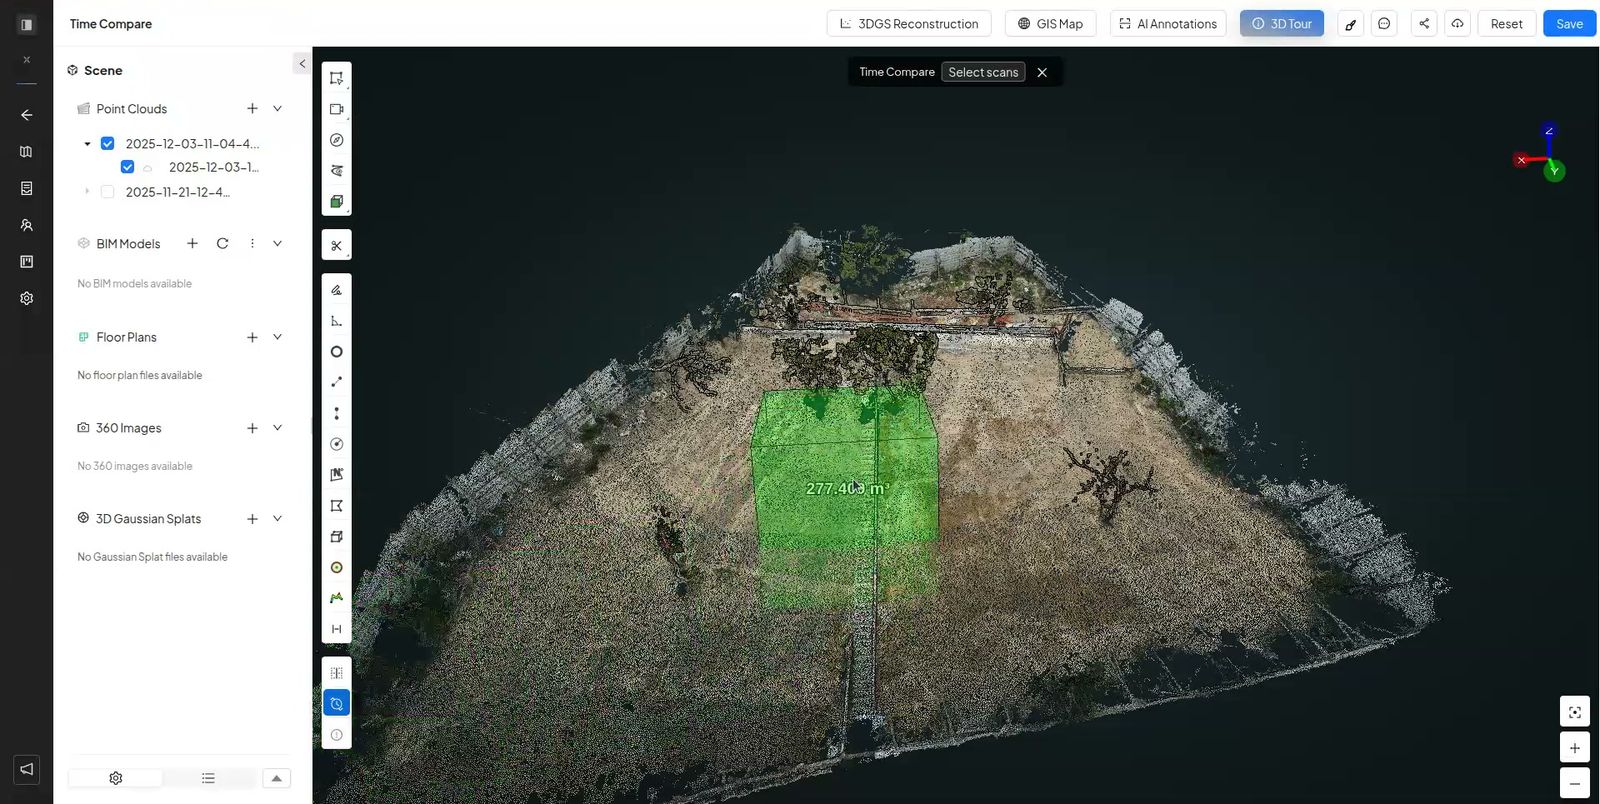
Draw a box around the area you want to measure, such as one stockpile or one excavation.
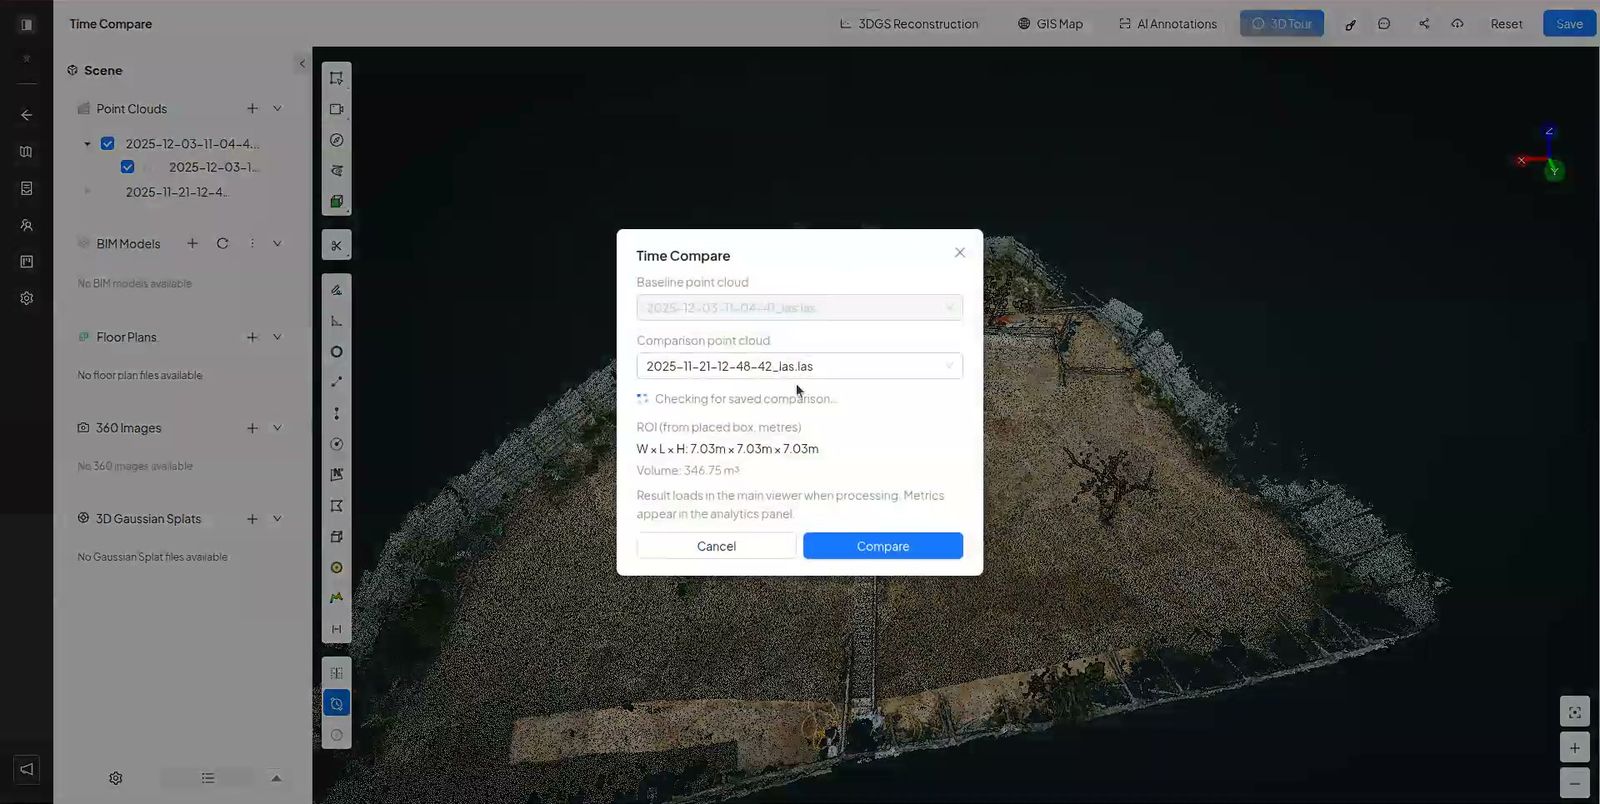
Start Time Compare and confirm the earlier (reference) and later (current) scans.
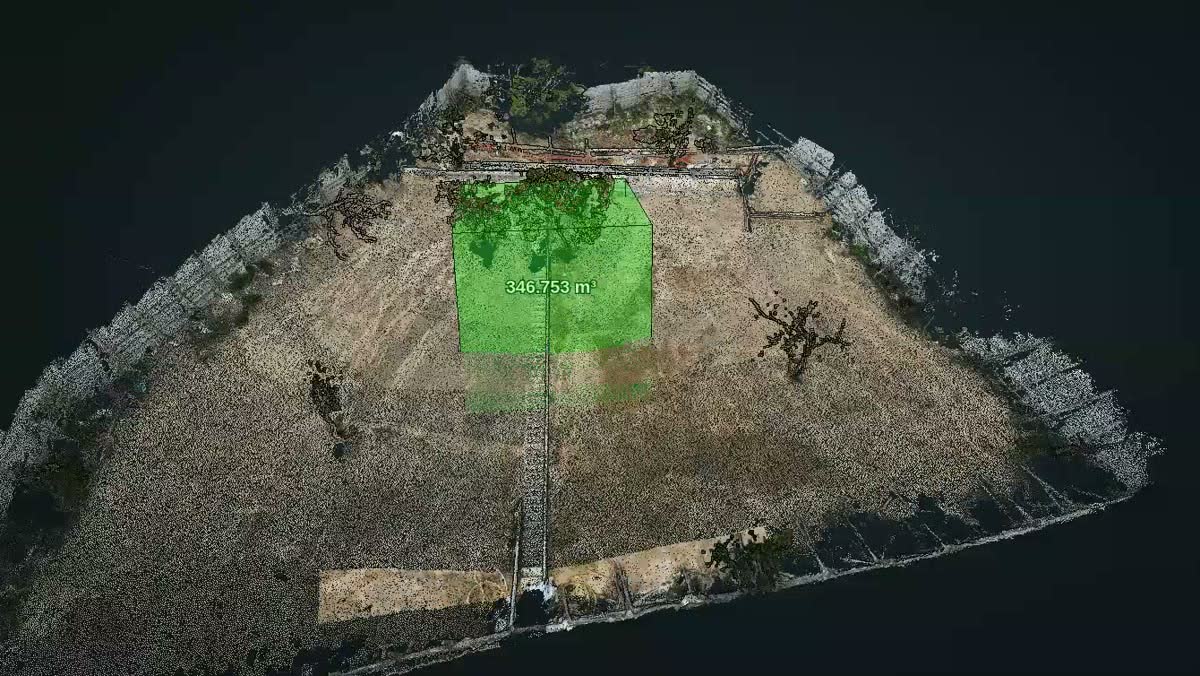
The zone shows cut and fill as a heatmap, with the net volume change in m³ and the height change in m.
People who praise volume tools in reviews tend to praise the same thing: getting a number without a second piece of software.
The scan lives in one place and the volume calculation in another, often on one person’s desktop.
When only the surveyor can run it, the number waits for the surveyor.
A single figure does not show where the material went, which is what the site team needs to know.
When the heatmap and the number sit next to the scan, the whole team can see where the earth moved, and the next conversation starts from the same figure.
Cut and fill along a new alignment, one zone at a time.
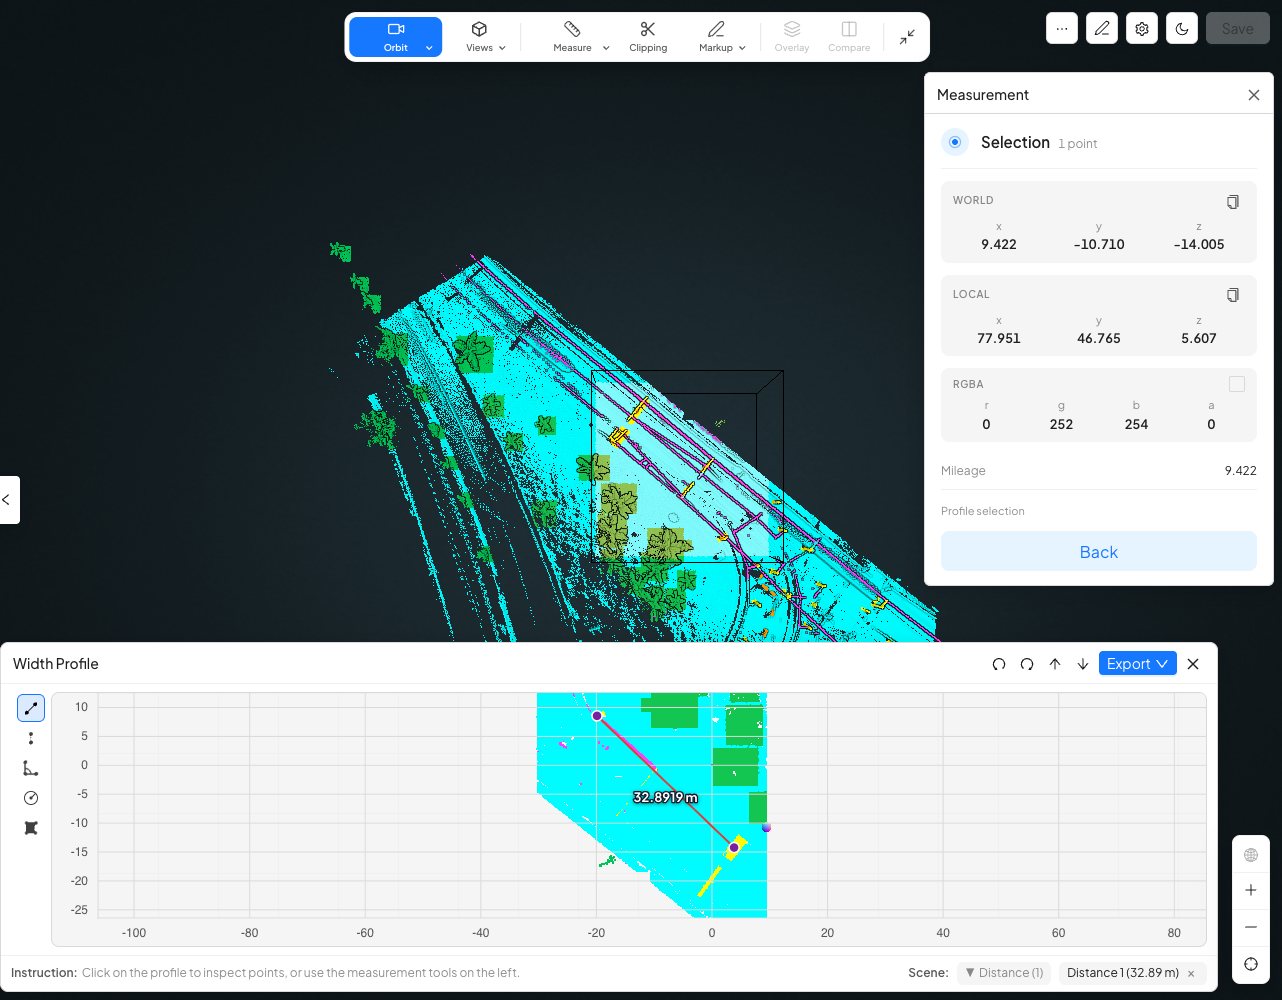
A width profile shows only the points inside a box, seen from above, ready to measure.
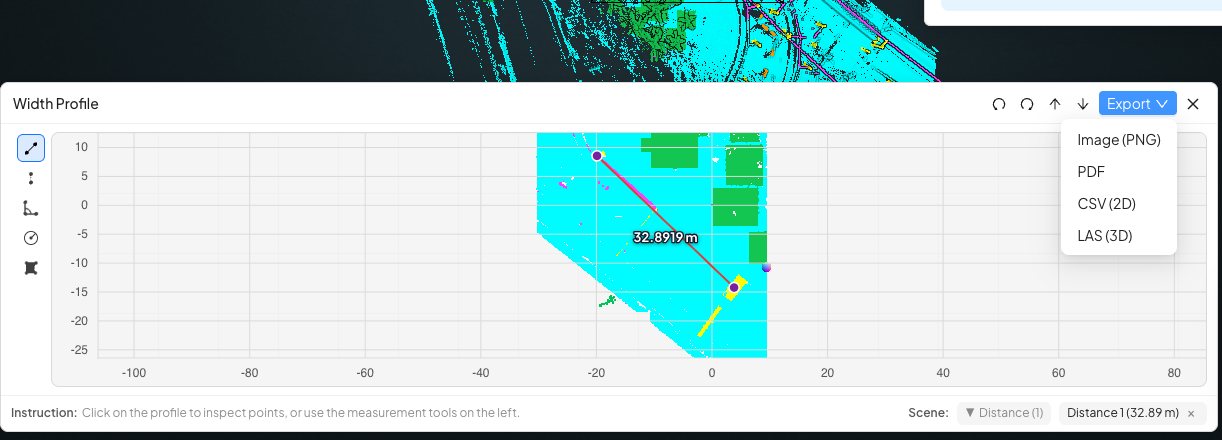
Export sections as PNG, PDF, CSV or LAS for your survey or design software.
The same two scans, worked two ways.
| Time Compare in SpatialSense | Separate volume software | |
|---|---|---|
| Where it runs | In a browser, next to the scans. | On a desktop with a licence. |
| Who can run it | Organisation admins and supervisors; everyone else can view the results. | Usually one specialist. |
| What you see | A cut and fill heatmap plus the m³ figure. | Often a figure and a report. |
| History | Saved with the survey. | In files on someone’s machine. |
| Sharing | Unlimited users, or a link without a login. | Export and email. |
Two scans of the same ground, from different dates.
You need two scans of the same ground from different dates, both georeferenced. In SpatialSense, draw a zone on the point cloud, start Time Compare, confirm the earlier and later scans, and read the cut and fill heatmap and the net volume change in m³.
Yes. Time Compare runs in the browser on scans in your SpatialSense project, with nothing to install.
Anything that moved between scans counts, including machines, people and stored materials. Draw the zone to avoid them, or allow for them when you read the results.
Either works. Upload a point cloud from a drone flight or a laser scanner as E57, LAS, LAZ, PCD or PLY.
Organisation admins and supervisors can run it. Members can view the heatmaps and figures from earlier runs.
Upload two scans of the same ground, draw a zone, and see where the earth moved.