The Definitive Guide to Construction Project Visualization Tools in 2026
Recent industry reports reveal a staggering reality: 95% of all site data captured on construction projects goes completely unused. That is a massive waste of potential intelligence. You are likely feeling the friction of data silos between the field and the office every single day. Finding the right construction project visualization tool shouldn't mean investing in expensive workstations or waiting hours for a point cloud to sync. It's time to stop letting your data sit idle while site errors compound.
The gap between a 3D model and the actual as-built reality is where expensive rework lives. We agree that the traditional, fragmented workflow is fundamentally broken. This guide shows you how to unify BIM, point clouds, and 360° imagery into a single, browser-native environment to eliminate those discrepancies. We will explore how to gain instant access to as-built data and use deviation detection to stop errors before they cost you. Here is your roadmap to a unified view of all project assets and faster site decisions in 2026.
Key Takeaways
- Stop letting 95% of your captured site data sit idle by breaking down silos between BIM models and field imagery.
- Learn why a modern construction project visualization tool must be browser-native to provide the field intelligence needed to eliminate rework.
- Cut hardware costs by moving from bloated desktop software to streamlined, real-time browser workflows that work on any device.
- Follow our 5-step implementation guide to audit your existing methods and select a platform that unifies all spatial data formats.
- Deploy the SpatialSense Platform to achieve instant as-built visibility and proactive deviation detection across your entire project team.
The Crisis of Fragmented Data: Why Visualization Fails in the Field
The construction industry is drowning in data. We capture everything. Laser scanners, drones, and 360° cameras run daily across every major site. Yet, 95% of this captured data goes completely unused. It's a massive failure of implementation. Most site teams can't actually see or interact with the information they've collected. This isn't just a technical glitch; it's a structural bottleneck. When your construction project visualization tool requires a high-end workstation to open a point cloud, that data stays trapped in the office. It never reaches the people who actually need it on the ground.
Fragmented silos make the problem worse. Field engineers often jump between a BIM viewer, a photo gallery, and a spreadsheet. These tools don't talk to each other. Switching apps takes time. It breaks focus. More importantly, it hides the truth. You can't see how a pipe in a 360° photo deviates from the Building Information Modeling (BIM) design if they live in separate software environments. This fragmentation creates a blind spot that leads directly to rework. It's a disconnect that costs money every single hour.
Latency is the final killer of field adoption. Site teams don't have time for loading bars. If a point cloud takes five minutes to render on a tablet, the engineer will put the tablet down. They'll guess. They'll rely on memory. Slow sync times aren't just annoying; they're a liability. This "Hardware Tax" creates a divide between the digital twin and the physical reality. If your visualization strategy relies on local processing power, it's destined to fail in the field where connectivity and hardware are often limited.
The True Cost of Visualization Bottlenecks
Rework isn't cheap. It's the direct result of outdated as-built documentation. When site engineers can't verify a slab's elevation against the model in seconds, mistakes happen. Communication breaks down. Remote stakeholders are left guessing based on "send-and-wait" workflows that take days to resolve. These delays ripple through the schedule. By 2026, the speed of your site decisions determines your margin. You can't afford to wait for a data sync while the concrete is pouring.
Why Traditional Desktop Software is Obsolete for Site Teams
Local installations are a relic. They require constant updates and specific operating system versions that site teams don't have time to manage. Modern teams need a construction project visualization tool that just works. Traditional software struggles with format incompatibility between IFC, LAS, and E57 files. It forces users to be data translators instead of builders. The industry has moved toward mobile-first, web-native documentation. If you can't access your 3D data in a browser, you're already behind the curve.
What Defines a Modern Construction Project Visualization Tool?
A modern construction project visualization tool isn't just a 3D viewer. It's a unified command center. True visualization integrates Building Information Modeling (BIM), high-density point clouds, and 360° site imagery into one interface. Most legacy systems force you to view these in isolation. That's a mistake. When design models are separated from site reality, you lose context. A modern platform overlays the design directly onto the real-world scan. This creates a "truth" layer. It allows site teams to identify deviations before they become rework. It turns fragmented data into a cohesive story.
Beyond 3D: Integrating BIM, Point Clouds, and 360° Imagery
Contextual visualization changes everything. Seeing a 3D model in a vacuum is useless for a field engineer. They need to see that model inside a 360° site photo. Point clouds provide the geometric precision needed for as-built verification. By combining these, you create a single source of visual truth. This approach mirrors advanced transportation visualization techniques used to manage complex infrastructure projects. It's about clarity. It's about making sure every stakeholder sees the same reality at the same time. No more guessing which version of the scan is current or which photo matches the design.
Web-Native vs. Cloud-Hosted: Understanding the Architecture
Architecture matters. Many tools claim to be "cloud-based" but still require heavy local processing. They're just desktop apps with a sync button. Browser-native tools are different. They process data on the server and stream it to your device. This is "zero-footprint" viewing. It means you can open a five-gigabyte point cloud on a standard tablet without lag. Scalability is no longer limited by your hardware. You can manage terabytes of scan data in a standard browser window. This accessibility is what drives field adoption. If you're looking for a platform that delivers this level of performance, exploring the SpatialSense Platform is a logical next step.
The next frontier is automated deviation detection. Visualization is moving from passive observation to proactive analysis. Modern tools don't just show you the data. They highlight the discrepancies. They compare the as-built point cloud to the as-design model automatically. This identifies if a pipe is two inches out of place before the walls go up. It turns raw data into actionable field intelligence. This isn't a luxury anymore; it's a requirement for 2026 project delivery. You need to know your site is right, not just hope it matches the drawings.
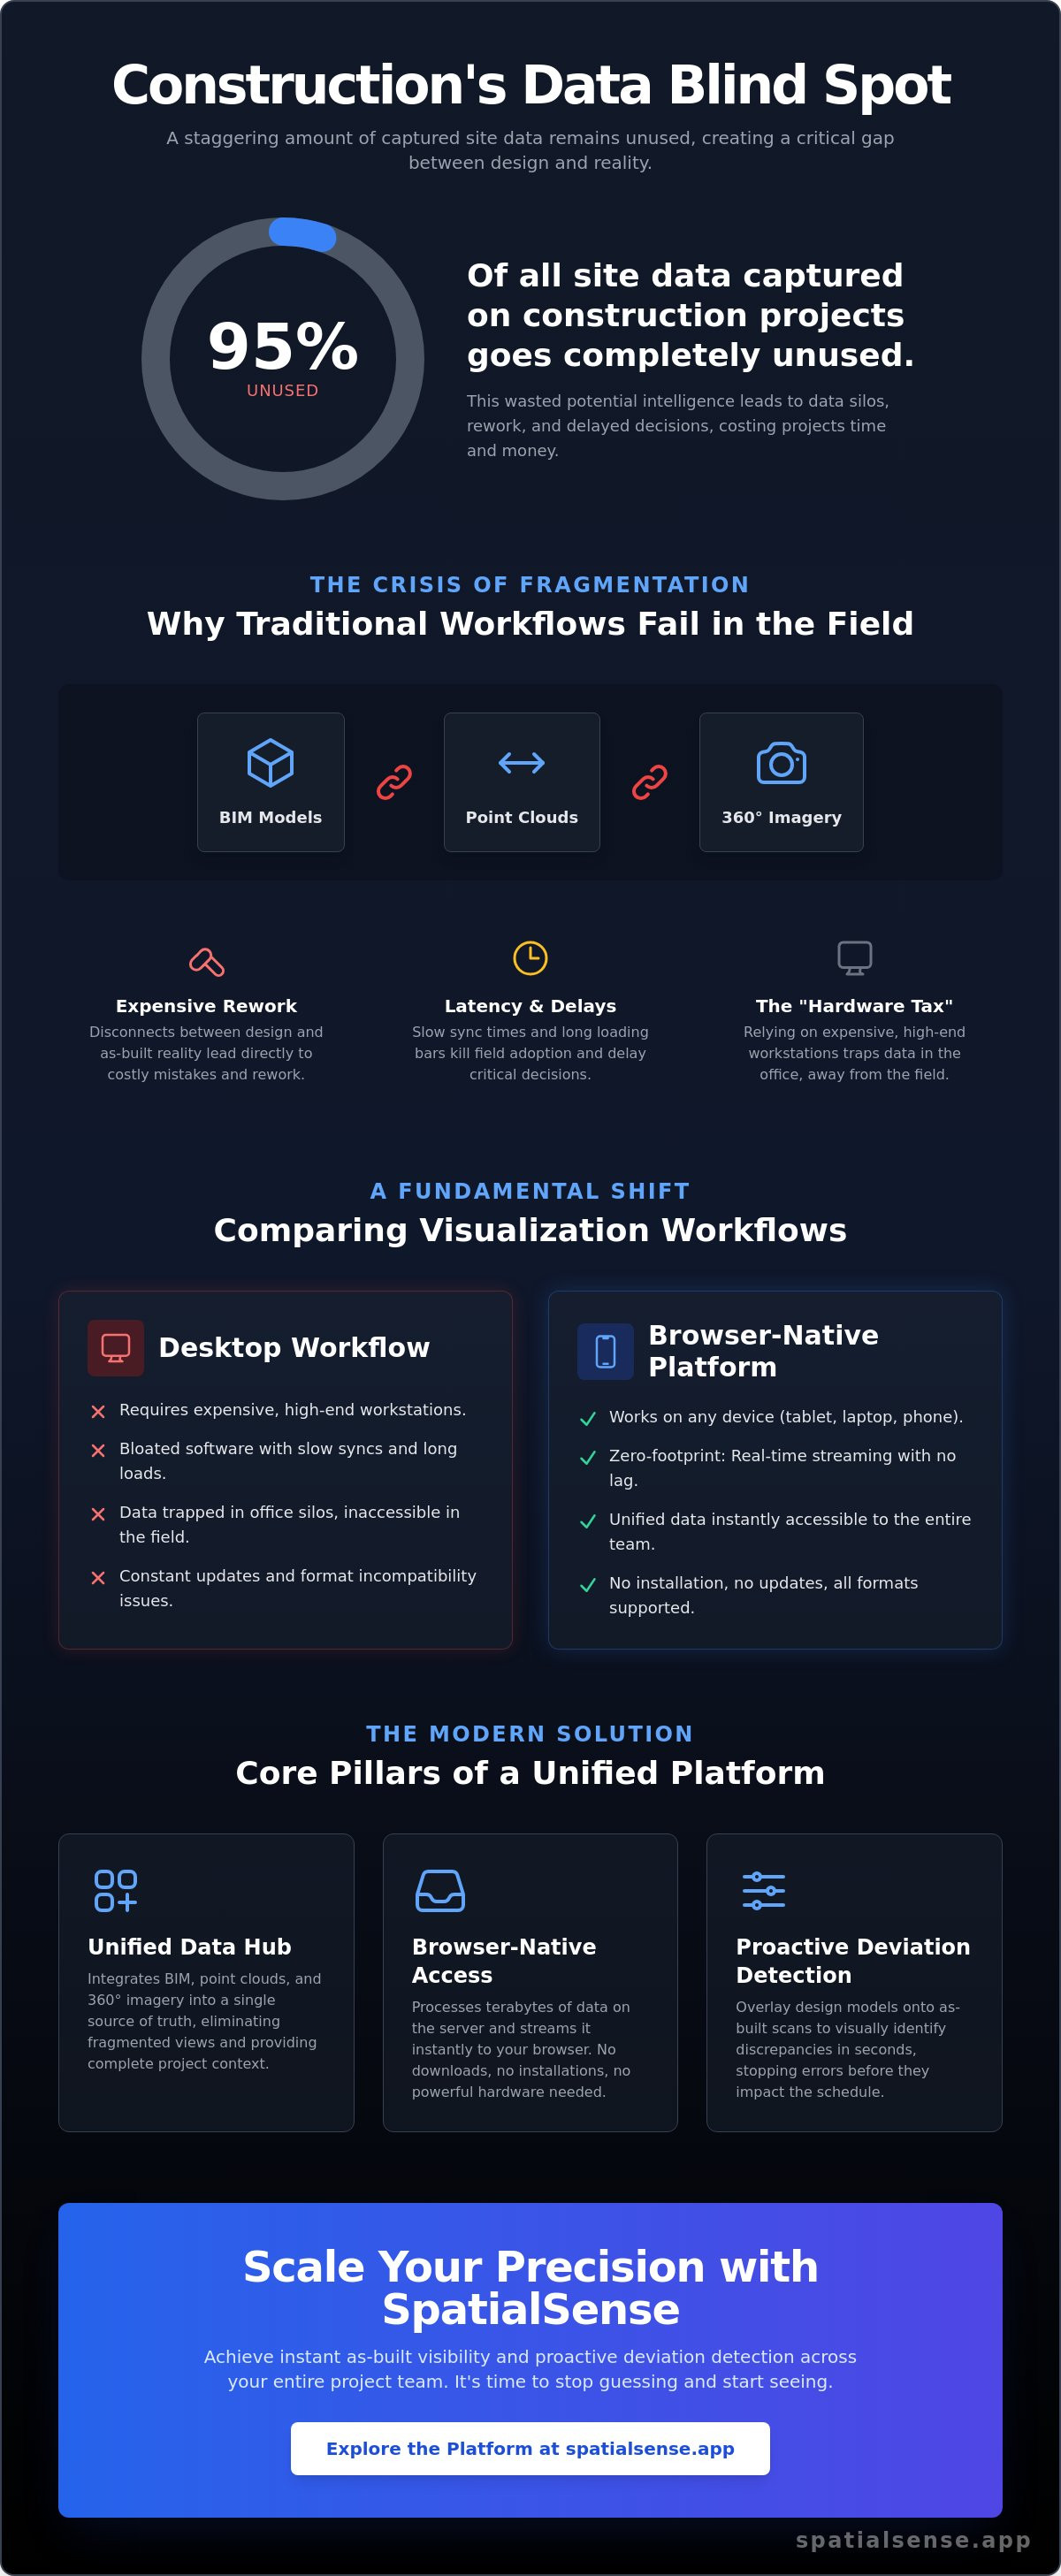
Comparing Visualization Workflows: Desktop vs. Browser
Performance is the ultimate gatekeeper of field adoption. If your construction project visualization tool requires a high-end workstation with a dedicated GPU, it isn't a field tool. It's an office anchor. Traditional desktop workflows create a physical barrier between the data and the jobsite. Browser-native platforms remove this barrier. They shift the heavy lifting from the local device to the server. This transition isn't just a technical upgrade; it's a fundamental shift in how teams operate. It moves the intelligence from a siloed hard drive to the palm of every worker's hand.
Eliminating the 'Hardware Tax' in Field Inspections
The "Hardware Tax" is the hidden cost of traditional software. It's the requirement for expensive, fragile laptops that don't belong in a dusty, high-traffic environment. Browser-native tools democratize data access. They allow every site worker to access high-fidelity models on a standard tablet or smartphone. This reduces IT overhead significantly. There are no local installations to manage and no patches to push. Field engineers can perform virtual site walks on-the-go, comparing the as-built reality to the model without leaving the slab. This accessibility turns every mobile device into a powerful inspection asset.
Real-Time Collaboration: The End of the 'Send-and-Wait' Era
Manual file uploads are a relic of the past. In the desktop era, sharing a point cloud meant "send-and-wait." You'd upload a massive file and wait for the remote team to download it. That's too slow for 2026. Modern browser workflows enable instant data synchronization. When a scan is captured, it's immediately available to the head office. This facilitates remote inspections that feel like being on-site. Stakeholder buy-in improves because you can share an interactive 3D scene via a simple URL. It's direct. It's fast. It removes the friction that usually kills collaboration.
User adoption follows the "10-minute rule." If a site worker can't navigate the interface within ten minutes, they'll revert to paper and memory. Desktop software is often too complex, buried under layers of menus. Browser-native tools prioritize a clean, intuitive experience. They mirror the digital-native apps workers use in their daily lives. While licensing fees are a factor, the real value lies in the reduction of rework. One avoided error pays for the platform subscription many times over. Choosing the right workflow isn't just about software; it's about empowering your team to make faster, better site decisions. It's about logic, speed, and the elimination of technical waste.
How to Implement a Visualization Tool: A 5-Step Guide
Implementation isn't a technical hurdle. It's a workflow decision. You don't need a GIS degree to deploy a construction project visualization tool. You need a logical sequence that connects site reality to office design. Skip the complex setups. Focus on immediate field utility. Here is the path to a unified site workflow.
- Step 1: Audit your data capture methods. Catalog your hardware. Know if you're using high-end laser scanners, drones, or 360° cameras. Your tool must support your current reality.
- Step 2: Select a unified platform. Avoid software that requires constant file conversion. Choose a system that natively supports BIM models and massive point cloud formats in a single browser view.
- Step 3: Establish a field-to-office sync. Eliminate the "send-and-wait" era. Set up direct data paths that allow site scans to be visible to remote stakeholders within minutes, not days.
- Step 4: Train the team on mobile apps. Focus on the field engineers. Use intuitive tools like the SpatialSense Trace Mobile App to document inspections directly from the slab.
- Step 5: Deploy deviation detection. This is where you see the ROI. Compare your as-built data against the design model to catch errors before they require costly rework.
Mastering Mobile Data Capture for Rapid Reporting
Speed wins in the field. 360° site walk-throughs provide more context than a thousand static photos. They create a continuous visual record. Ensure data accuracy by using standardized capture paths. Mobile apps bridge the gap. They turn a standard smartphone into a portal to the digital twin. This isn't just about taking pictures. It's about anchoring those images to the project coordinate system for absolute clarity. For a platform that streamlines this process, you should explore the SpatialSense Platform.
Turning Reality Capture into Actionable Progress Tracking
Raw data is just noise without analysis. Use your visualization platform to compare as-built point clouds to design BIM models automatically. This highlights discrepancies in red. It removes the guesswork. Generate automated reports for clients that show exactly where the project stands. Visualizing schedule progress through time-stamped 3D data provides a level of transparency that traditional spreadsheets can't match. You see the progress. You prove the quality. It's about logic, not just pretty pictures.
Scaling Precision with the SpatialSense Platform
SpatialSense isn't just another software layer. It's a lean, defiant alternative to bloated industry standards. This construction project visualization tool is built specifically for teams that can't afford to wait. Infrastructure projects generate massive datasets. Managing them shouldn't require a degree in IT or a high-end workstation that costs thousands of dollars. SpatialSense brings everything together. BIM models, high-density point clouds, and 360° site photos live in one unified interface. It's about giving you a single, clear window into the project's soul. No more switching apps. No more fragmented truth.
Unified Access: One Interface for Every Data Type
Performance is the ultimate priority. SpatialSense focuses on browser-native execution to ensure zero-lag viewing. This means you can handle terabytes of scan data without the typical stutter. You don't need a specialized GPU. A standard laptop or field tablet is enough. This approach eliminates the need for expensive, hardware-intensive software deployments across your organization. It democratizes data. A single subscription provides full access to both the platform and the mobile tools. It simplifies your tech stack and reduces your IT overhead significantly. Most importantly, it ensures that every stakeholder, from the site engineer to the remote executive, sees the same data at the same time. Logic and speed replace technical friction.
SpatialSense Trace: Bridging the Gap Between Site and Screen
The field is where projects succeed or fail. The SpatialSense Trace Mobile App is designed to keep site documentation simple and direct. It streamlines inspection sync by removing the friction of manual data entry. You capture the reality on the slab. The office sees it instantly. There are no manual uploads. There are no lost SD cards or corrupted files. This seamless synchronization turns raw site data into a living, breathing record of progress. Fragments of information become a cohesive narrative of the build.
It bridges the gap between the physical site and the digital screen. You identify discrepancies early. You fix them fast. This isn't about having "more" data; it's about having the right data when it matters most. You can stop guessing and start verifying. Ready to see your project clearly? Get started with SpatialSense today.
The era of fragmented, slow-loading data is over. Speed is now a core competitive advantage for infrastructure teams. SpatialSense delivers that speed. It provides the precision needed for modern project delivery without the complexity of legacy systems. It's time to stop fighting your software and start building with clarity. Unified visualization is here. It's browser-native. It's mobile-first. And it's ready for the field. Build with confidence. Build with SpatialSense.
Unify Your Site Reality Today
Site data is only valuable if it's accessible. You've seen the cost of fragmentation. You've felt the weight of the hardware tax. Moving to a browser-native construction project visualization tool isn't just a trend. It's a survival strategy for 2026. By unifying BIM, point clouds, and 360° imagery, you move from guessing to knowing. You eliminate rework. You accelerate site decisions. The path from data capture to actionable intelligence is now a straight line. No more silos. No more waiting for syncs.
SpatialSense provides the speed and precision your infrastructure team demands. Experience seamless cloud-based BIM and point cloud management without the lag. Deploy the SpatialSense Trace mobile app to bridge the gap between the slab and the office screen. It's time for web-native performance that handles your massive datasets with ease. Streamline your project visualization with SpatialSense. Take control of your site reality. Build smarter, faster, and with absolute clarity. Your team is ready for a better workflow.
Frequently Asked Questions
What is a construction project visualization tool?
A construction project visualization tool is a unified platform that integrates design models with real-world site data. It consolidates BIM, laser scans, and 360° imagery into one accessible interface. This creates a single source of truth for the entire project team. It enables stakeholders to track progress and verify as-built conditions without leaving their desks. Logic and visibility replace the guesswork of traditional site reports.
How does a web-native BIM viewer differ from traditional software?
Web-native viewers operate entirely within your browser. They don't require local installations or manual updates. Traditional software relies on your device's local processing power, which often causes lag with large files. Web-native architecture streams data directly from the cloud. It ensures every user sees the same version of the model instantly. This accessibility drives field adoption because the tool works on any device.
Can I visualize large point clouds in a standard web browser?
You can visualize terabytes of point cloud data in a standard browser if the tool is built for it. Modern streaming technology handles the rendering on the server side. This allows field engineers to navigate high-density scans on a standard tablet. You no longer need a high-end workstation to view your site's reality. It's a faster, more efficient way to interact with massive infrastructure datasets on the go.
What are the benefits of combining BIM and reality capture data?
Combining these datasets enables automated deviation detection. You can overlay the design BIM model on the as-built point cloud to see if everything is in the right place. This identifies discrepancies like misplaced sleeves or structural shifts in real-time. It turns passive data into a proactive tool for reducing rework. You catch errors before they become permanent, saving both time and budget.
Do I need special hardware to use a construction visualization platform?
No specialized hardware is required for a browser-native construction project visualization tool. You can access the full platform using standard laptops, tablets, or smartphones. The heavy processing happens in the cloud. This approach democratizes data access for every worker on the site, regardless of their device's specs. It eliminates the "hardware tax" that usually keeps digital twins trapped in the office.
How does mobile site inspection software improve project accuracy?
Mobile software captures documentation at the source. The SpatialSense Trace Mobile App allows site inspectors to link photos and notes directly to specific locations in the 3D model. This eliminates the delay of manual office uploads. It ensures that inspection records are accurate, time-stamped, and immediately visible to the entire team. Accuracy increases when you remove the gap between observation and documentation.
What file formats are typically supported by visualization tools?
Most professional platforms support industry-standard formats for interoperability. This includes IFC for BIM models and LAS, E57, or PLY for point clouds. They also integrate standard 360° JPG or MP4 files. Using these open formats prevents vendor lock-in and ensures your data remains useful across different project phases. It's about seamless integration between your scanners and your viewing platform.
Is browser-based visualization secure for sensitive infrastructure projects?
Modern browser-based platforms prioritize enterprise-grade security. They utilize end-to-end encryption and multi-factor authentication to protect project data. Hosting on secure cloud infrastructure ensures that sensitive infrastructure designs are only accessible to authorized personnel. It's often more secure than sharing unencrypted files via email or local drives. You maintain full control over who sees your data and when.